Cabo weather in short
Cabo San Lucas sits at the southern tip of the Baja California peninsula, and the figures on this page come from the official weather station at Cabo San Lucas, 15 m above sea level. They are climate normals for 1991 to 2020: the average daily high, the average daily low and the average monthly rainfall. They are not a forecast for your travel dates, so check a forecast a few days before you leave.
The pattern is simple. Late winter and spring are dry, summer is hot, and August and September bring most of the rain. If you plan boat days, compare the season with the boat tours from Cabo San Lucas before you choose your month.
Cabo weather by month
Average daily high and low and average rainfall, 1991 to 2020.
| Month | High | Low | Rainfall |
|---|---|---|---|
| January | 26.6 °C (80 °F) | 12.8 °C (55 °F) | 6.2 mm (0.2 in) |
| February | 27.0 °C (81 °F) | 12.9 °C (55 °F) | 3.4 mm (0.1 in) |
| March | 28.5 °C (83 °F) | 13.9 °C (57 °F) | 1.4 mm (0.1 in) |
| April | 30.1 °C (86 °F) | 15.4 °C (60 °F) | 0.0 mm (0.0 in) |
| May | 32.1 °C (90 °F) | 16.5 °C (62 °F) | 0.1 mm (0.0 in) |
| June | 32.6 °C (91 °F) | 18.5 °C (65 °F) | 0.4 mm (0.0 in) |
| July | 34.4 °C (94 °F) | 22.5 °C (73 °F) | 8.1 mm (0.3 in) |
| August | 34.7 °C (94 °F) | 23.8 °C (75 °F) | 76.4 mm (3.0 in) |
| September | 33.7 °C (93 °F) | 23.3 °C (74 °F) | 114.0 mm (4.5 in) |
| October | 33.4 °C (92 °F) | 21.2 °C (70 °F) | 24.4 mm (1.0 in) |
| November | 30.4 °C (87 °F) | 17.5 °C (64 °F) | 16.9 mm (0.7 in) |
| December | 27.4 °C (81 °F) | 14.0 °C (57 °F) | 7.3 mm (0.3 in) |
An average of 0.0 mm in April does not promise a dry day, and an average is not a forecast. For most visitors who want warm days with little rain, February to May is the stretch to look at first.
Our pick: an evening on the water
A sunset cruise makes the most of the evening light, and the wind forecast on the day tells you whether it is a good one.
Hand-picked tours, booked through Viator. Prices are indicative starting prices in US dollars (as of October 2026). Tap a tour for live availability and the current price in your currency.
Tours and day trips through the year
Boat tours, snorkeling and day trips from Cabo San Lucas, with live prices and availability.
Best time to visit Cabo San Lucas
The best month depends on what you want to do.
| Goal | Months to look at | Good to know |
|---|---|---|
| Dry, warm days | February to May | Average rainfall stays under 4 mm, and highs run from 27.0 to 32.1 °C |
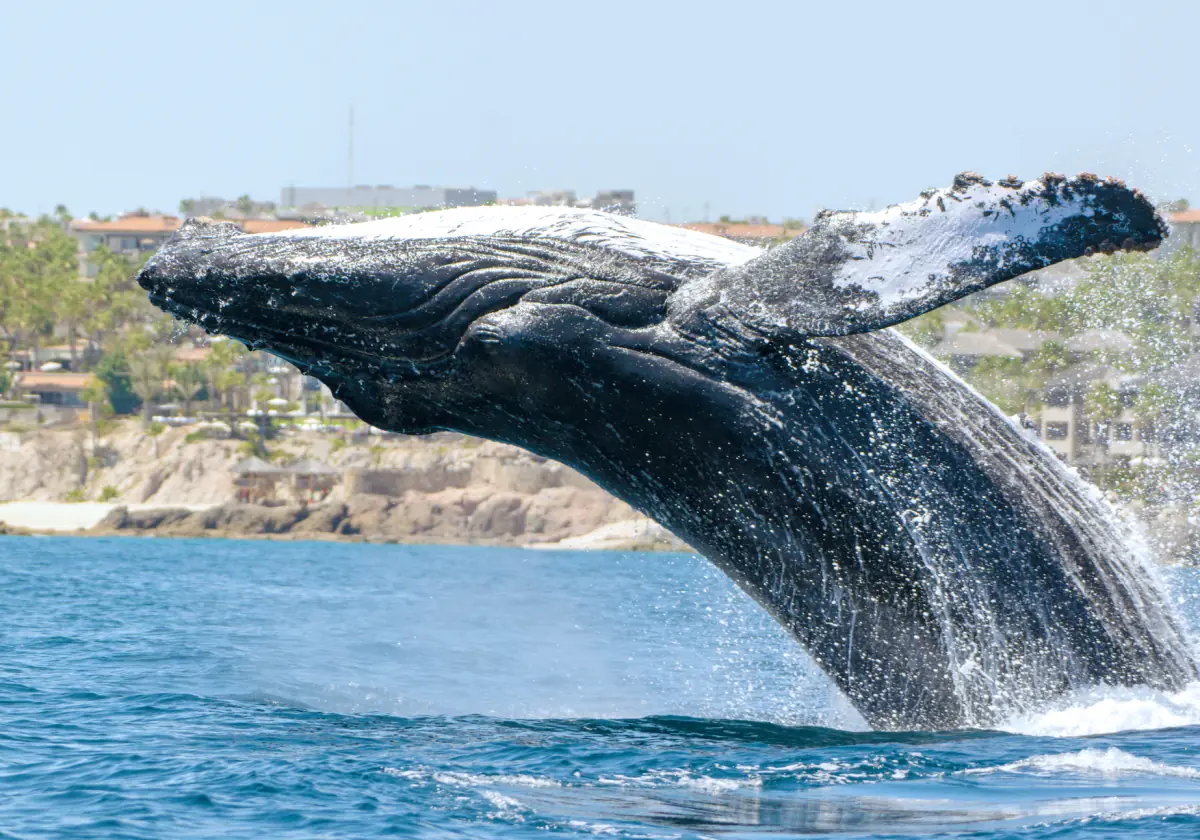
| Whale watching | Mid-December to April | The 2025/26 season ran from 15 December 2025 to 30 April 2026. Dates for winter 2026/27 are set each year, so check them with your provider |
| Least heat | December to March | Highs between 26.6 and 28.5 °C, nights down to 12.8 °C in January |
| Warmest nights | July to September | Lows of 22.5 to 23.8 °C, but August and September are the wettest months |
| Lowest rainfall | March to June | Average rainfall from 0.0 to 1.4 mm a month |
For most travelers, the dry stretch from February to May suits boat trips and beach days well. Whale season overlaps the dry months from February to April, so a trip in those months can cover both.
Whale watching has its own page with the season dates and the rules for boats. See whale watching in Cabo San Lucas before you fix your dates.
Cabo weather in November
The end of the hurricane season.
November averages a high of 30.4 °C (87 °F), a low of 17.5 °C (64 °F) and 16.9 mm of rain. It is drier than October, which averages 24.4 mm, and much drier than September. The eastern Pacific hurricane season ends on 30 November, so the whole month falls inside it. Nights cool down by December, when the average low is 14.0 °C (57 °F).
Hurricane season and rain
Dates and what they mean for a trip.
The window
The hurricane season in the eastern North Pacific, which includes Cabo San Lucas, runs from 15 May to 30 November. Some general travel advice for Mexico gives June to November, so use the longer window of 15 May to 30 November for Cabo.
The wettest weeks
August and September bring 76.4 mm and 114.0 mm of rain on average. That is far more than any other month, and it overlaps with the hurricane season.
Waves and beaches
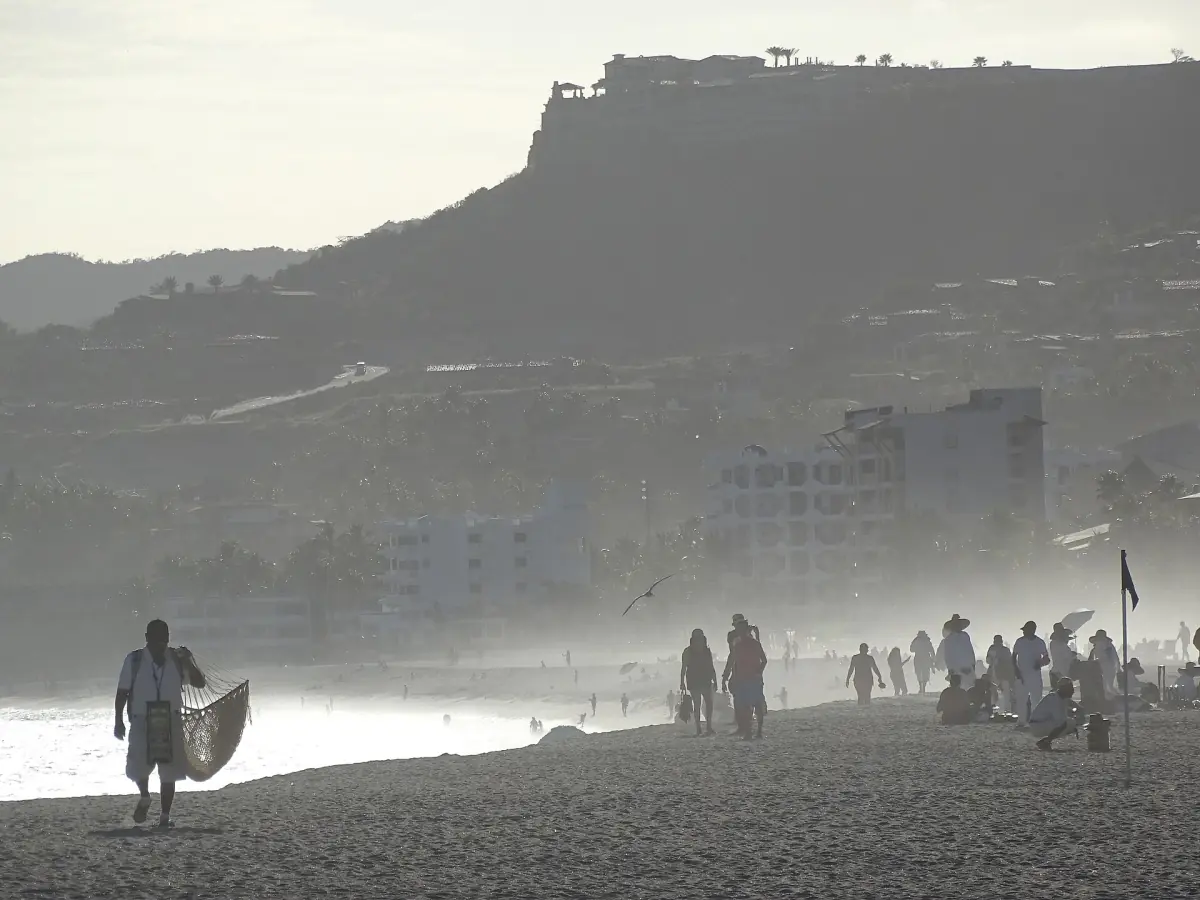
High waves lead to beach closures with black flags. A black flag means the beach is closed and the sea is off limits. Read the flags on the day and see the safety guide and the beaches guide for what the colors mean.
Plan with flexibility
If you travel in the season, check the cancellation terms of your trip and your boat tours before you pay.
Plan the rest of your trip
Where and when to go next.

Cabo weather: frequently asked questions
What is the best time to visit Cabo San Lucas?
It depends on your goal. February to May is the driest stretch with highs from 27.0 to 32.1 °C, and whale season runs from mid-December to April. August and September are the wettest months.
What is the weather like in Cabo in November?
The average high is 30.4 °C (87 °F), the average low is 17.5 °C (64 °F) and the average rainfall is 16.9 mm. The hurricane season ends on 30 November.
When is the hurricane season in Cabo?
The eastern Pacific hurricane season runs from 15 May to 30 November. Rain peaks in August and September.
Which month is the hottest?
August has the highest average high at 34.7 °C (94 °F) and the highest average low at 23.8 °C (75 °F).
Are these figures a forecast?
No. They are averages for 1991 to 2020, so use a current forecast a few days before you travel.